The cash flow statement is the final piece of the puzzle when it comes to the monthly management reports that we prepare here at Creative CFO. This is without a doubt one of the most important and often overlooked financial reports within the monthly report pack.

The cash flow statement in context

The profit and loss statement, discussed in an earlier blog, provides information on the revenue and expenses over a certain period of time. This is used alongside the balance sheet, which gives a snapshot of the financial health of a business. Out of the information from both of these reports, the cash flow statement is born.

Cash is the heartbeat of a business. A business requires cash to be able to pay its suppliers, vendors and employees, but it also needs cash to be able to invest back into itself in order to grow. The cash flow statement can show how effectively a business is managing its cash inflows and outflows over a specified period of time. This is particularly important to investors seeking to determine the short-term viability of your company, particularly its ability to generate cash and pay bills.

In accounting terminology we often refer to “accrual versus cash accounting”, and this really sums up the importance of understanding the cash flow statement and how it can be utilized to grow your business. “Accrual versus cash” refers to the method in which a report is drawn up. Accrual accounting reports on revenue when it is earned and expenses when they are incurred. Generally, your profit and loss statement is drawn up on the accrual basis. This means that you could earn revenue by invoicing your customers and this will reflect on your profit and loss statement, but until cash changes hands and you receive the money in your bank account, it will not increase your cash immediately. In essence, profits do not always equal cash.

When we look at our monthly reports, it is common to go straight to the balance sheet to see what the bank balance was at month end. However, it does not necessarily tell you how it came in or went out during the month.

Breakdown of the cash flow statement

Let’s take a closer look at the components that make up a typical cash flow statement by using the example below.
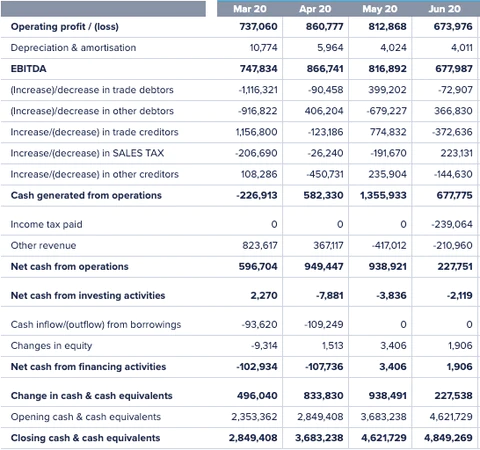
Based on the indirect cash flow method, we will start with the operating profit/loss which is pulled directly from the profit and loss statement. This is then adjusted to take into consideration non-cash movements, as well as cash movements, to reconcile at the end of the report with the actual cash balance that you have in the bank at a specific month end.

Depreciation and amortisation are always adjusted for, i.e. added back, as no physical cash leaves the business for these transactions. The only time that cash is affected is when we actually buy the asset. Depreciation and amortisation simply show how the expense is allocated over its useful life.

We can then split the rest of the report into three main sections:

1. Cash generated from operations

This is such an important section of the cash flow report as it showcases how the core of your business is generating and utilizing cash. If we take a look at the movements that are represented in the above image, we can establish how these movements affect the amount of money we have in the bank.

For example, if we take a look at the (increase)/decrease in trade debtors – this would be your customers whom you have invoiced, and if this figure increases then we adjust the net income by deducting the increase, and if it decreases, we adjust with a positive figure.

At the end of the cash flow from operations, you ideally want to see a positive number here, otherwise the company is not raising its cash from its core business activities which could raise a couple of red flags. One of the most common causes of this could be that your cash is tied up – you are perhaps giving your customers long payment terms or your receivables are very overdue – which means you have to continue paying your expenses and suppliers before you have actually received the cash from your customers.

2. Net cash from investment activities

This is cash spent or received from investments, which is outside the core of the business. If you perhaps purchase a new asset or purchase shares in another company this will be reflected here.

3. Net cash from financing activities

This represents the raising, borrowing or repaying of loans and issuing of new shares or dividends paid, to name a few. If you receive a loan from the bank, the cash comes in, so this will be represented as a positive amount on the cash flow statement. This is then easily identifiable to the person reading the report that money has come in. When the company repays the principal portion of its loans, this will be presented as a negative amount, which means that cash was used which reduces the bank balance.

Managing cash flow is vital for business success, it really can be summarized as doing anything and everything possible to ensure money is coming into the business as quickly as possible and exiting as slowly as possible. In order to summarise the cash flow statement visually we use the waterfall representation as part of the monthly management reports, an example of which is below.

Tips for getting the most out of your cash flow statement

To end off, we will leave you with a few of our top tips to keep in mind for when you are next reviewing your cash flow statement and forecasting for the upcoming months:

  • Profit does not equal cash, so don’t count income until it’s in the bank.
  • Plan for the unexpected. Before you purchase that awesome new coffee machine, make sure you have cash in the bank to cover at least two months’ operating expenses.
  • Be prepared for growth. When a business grows, it more often than not comes with additional costs which can include marketing, buying additional inventory or on-boarding additional resources.
  • Line up your invoicing and collections. Too many small businesses land up with customers with long outstanding debts. Make sure to stay on top of your debtors or implement a debit order system from the start.
  • Always have an up-to-date cash flow forecast. It is vital to know what your cash commitments are for the upcoming year.

The cash flow statement is one of the most integral components of the monthly management report pack that Creative CFO provides. Now that you know what it means to have an up-to-date cash flow statement, get in touch with us to discuss your business’s financial reporting needs.

Related Insights.

European vs South African Valuations – A Triple Edged Sword

Read More

NEW DESIGN – 2020 Tax Filing Season for Individuals

Read More

Systems Newsletter – VEND/YOCO Integration

Read More

The Melting Ice Cube Series – Part 1 – Holding Cash: A Melting Ice Cube

Read More

An introduction and high-level overview of the value of management reports [Part 1/4]

Read More

Manufacturing in Xero Part 2

Read More

Manufacturing in Xero Part 1

Read More

Manufacturing in Xero Part 3

Read More

A balance sheet is a document that outlines the business’s value. It does this by listing three main things: the assets that a business owns, the liabilities that a business owes, and the equity, which is the assets less liabilities.

The balance sheet forms part of the management report pack that Creative CFO produces. Often, the balance sheet can be quite challenging to understand, so we have made it our mission to make it visually understandable.

What is the purpose of a balance sheet?

The purpose of a balance sheet is to give interested parties an idea of the company’s financial position, in addition to displaying what the company owns and owes. It is important that all investors know how to use, analyze and read a balance sheet. A balance sheet may give insight or reason to invest in the business.

Components of the balance sheet

The balance sheet consists of three main components:

  1. Assets – what the business owns
  2. Liabilities – what the business owes
  3. Equity – this is assets less liabilities and represents the accounting business value.

What does a healthy balance sheet look like?

Every business owner wants to know that their balance sheet is looking good. But what exactly does this mean? We have recorded a short video to explain.

What steps can be taken to improve the balance sheet?

When a business’s balance sheet is not looking too healthy, the business owners might consider taking some steps. The balance sheet can be improved in a couple of ways. Some steps can be taken immediately, but mostly the business owners have to put longer-term strategies in place to ensure positive change in the business’s financial position.

If the strategy of the business is to improve equity and make the business more attractive for potential investors, the following steps can be taken:

Immediate actions

  1. Pay close attention to inventory control
  2. Improve debt collection days
  3. Review all business expenses and ensure that the cost are needed to increase profitability
  4. Review procurement strategy and negotiate with suppliers for better rates
  5. Look for “low hanging fruit” opportunities in terms of sales.

Longer-term actions

  1. Put a strategy in place to see how debt can be paid off faster
  2. Review underperforming assets and consider selling if necessary
  3. Ensure the business stays cash positive and saves for a rainy day.

When is a business insolvent and what does it mean for directors?

One important use for a balance sheet is to show whether or not a business is insolvent.

A business is insolvent when its total liabilities exceed its total assets. In other words, the business owes more than it owns. This shows that a company is in financial distress.

The Companies Act 71 of 2008 defines “financially in distress” in section 128 (f) as:

  1. reasonably unlikely that the company will be able to pay all of its debts as they fall due and payable within the immediately ensuing six months, or
  2. reasonably likely that the company will become insolvent within the immediately ensuing six months.

There are two types of insolvency:

  1. Technically insolvent: Liabilities are more than assets (fairly valued)
  2. Commercially insolvent: A business is unable to pay its debts even though the assets may exceed liabilities.

It is the directors’ responsibility to assess insolvency and to ensure that the business will be able to continue as a going concern in the foreseeable future. Should there be warning signs of the business not being able to continue as a going concern directors need to take immediate action by seeking legal and financial advice. Should a director not take the necessary steps, they may be held responsible for losses incurred.

When is the best time to get a balance sheet?

Now is the best time to get a balance sheet, but more importantly any business should monitor their balance sheet on a regular basis and the goal should be to improve the balance sheet. Creative CFO is well equipped to prepare a balance sheet for your business.

Speak to our  helpful consultants they are available for your reporting and business processing needs.

👉   READ: Part 4 – Understanding and achieving a healthy cash flow

Related Insights.

Equity Incentives – A game changer for SMEs

Read More

How cloud accounting made me enjoy the finance industry again

Read More

The Melting Ice Cube Series – Part 1 – Holding Cash: A Melting Ice Cube

Read More

Manufacturing in Xero Part 3

Read More

South African Taxation Considerations of Virtual Currencies for Individuals

Read More

Financial Due Diligence in a post-Covid world

Read More

COVID 19: Working from home tax deduction

Read More

How to have successful team catchups and run effective meetings, remotely

Read More

The profit and loss statement (or P&L in accounting jargon)  is arguably the central management statement for most SMEs, recording the majority of operational activities over any period of time, usually monthly. Ranging from the total revenue received to all the expenses incurred by the business over the period, the P&L is a treasure trove of information for any business owner.

This article aims to provide a detailed explanation of the role of the P&L, what information it contains, how to use it to determine an array of essential business health indicators, as well as how to set up a simple, well-tailored P&L structure for your own business.

BASIC FORMAT OF THE P&L

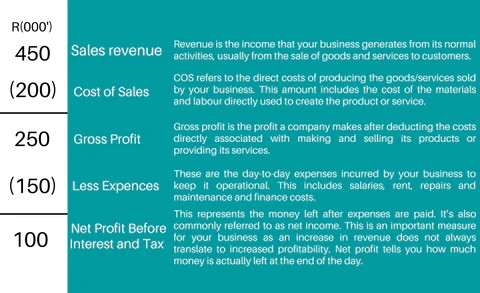
Modern cloud-based accounting platforms allow for sleek and elegant layouts of the P&L. Modern platforms also mean that it can be built in a highly customisable way, tailored to the specific needs of the business owner. The five main sections of the P&L are shown below. This is the most essential, bare-bones P&L format and really tells us only two things: How much money came in, and how much money went out.

The P&L’s skeleton is shown below:

Now that the skeleton is in place, we can start to flesh things out a bit.

We can add different revenue accounts for various income streams, or set up tracking categories – but more on this later. We can also create cost of sales accounts that show the direct expenses incurred to generate specific revenue items, as well as the other general expenses and overheads (OPEX) which the business has incurred over any given period of time, ranging from rent and salaries to staff welfare and entertainment.

GUIDING PRINCIPLES

Someone once said, “It ain’t simple being cool, but it’s cool being simple”, so keep it simple and avoid an overcrowded statement. Analyse your business’s revenue streams and major expenses and design your P&L layout accordingly. Keep the focus on the most important thing.

For revenue, ensure that you have a streamlined process for your invoicing and payment platforms. Cloud-based accounting tools are brilliant at setting up connections and integrations (called APIs) with other cloud-based tools and applications. It’s like one big ecosystem of chattering computer applications floating around in the cloud. Setting up your revenue and invoicing processes to be automated as far as possible is a great help towards the overall integrity of your business data. It also saves an incredible amount of time!

The same applies when capturing expenses through platforms like Receipt Bank – a simple system can go a long way in ensuring the accuracy and completeness of your P&L’s expense information. Clean revenue and clean expenses. Fantastic!

ANALYSING THE P&L: FROM DATA TO INFORMATION TO KNOWLEDGE

The management gurus are forever telling us to “measure what matters”. This applies to the P&L too. You can use the data from the P&L to identify key performance indicators rather than a myriad of confusing technical data. Determine what is really important and do not settle for standardised, generic reports.

The true value of the P&L is realised when relevant information is identified from within the report, turned into knowledge and used to the business’s advantage. Based on the industry, age, size and goals of the company, various key ratios can be determined. Using the correct software to prepare your statements will also simplify these ratios. Ratios can be presented and interpreted easily by converting them into colourful graphs and diagrams.

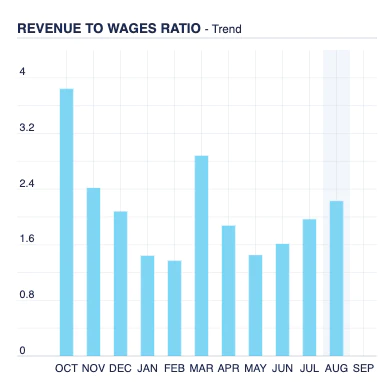
As an example, in service-based industries, salaries generally make up the largest portion of monthly expenses. From the profit and loss statement a revenue-to-salaries ratio can be determined. This provides business owners with valuable insight into their ability to pay salaries when revenue decreases.

An example of a revenue-to-salaries (in this case, revenue-to-wages) ratio is shown below:

A few basic questions to ask ourselves could be:

  • How is revenue growing?
  • What is the general gross profit % of the business?
  • What portion of monthly revenue goes to covering overheads and other expenses?
  • What are the main monthly overheads?
  • What is our “baseline” overhead expenditure on a monthly basis?
  • What does the bottom-line (the net profit) look like, month-on-month?
  • Where can we eliminate unnecessary costs?

The 80/20 rule (also called the Pareto Principle) can be easily applied and often delivers fantastic insights to hidden or obscured information. It is a surprising universal law that works well in the context of the P&L. Using the Pareto Principle, ask yourself some of these questions when looking at the P&L of your business:

  • Which clients are responsible for 80% of revenue?
  • Which products/services are responsible for 80% of revenue?
  • Which expense line items account for 80% of the monthly cash outflow?
  • Which marketing tools bring in 80% of the revenue-generating leads?

This is by no means an exhaustive list, but it should get you thinking in terms of this mysterious universal law. Try it, you might be amazed at the insights that can be gleaned from this simple approach.

XERO’S ADDITIONAL USEFUL FEATURES

As mentioned previously, the P&L consists of two main components: revenue and expenses.

Our revenue’s data integrity will come down to how well the invoicing function is run in Xero. Set up “Item Codes” for each product or service to ensure that invoicing is quick and easy, containing all the necessary information relevant to the product or service being sold.

Tracking Categories can also be created to assign both revenue and expenses to certain products, projects or services for “per product” reporting. Tracking Categories is a powerful tool to segregate different segments/departments/products/services and so on within the business to gain visibility on them in isolation. Reach out to us if you need help setting this up.

Once again, you don’t want to create administrative burdens by incorporating excessive detail which will result in you drowning in the complexity of your own design. Keep it as simple as you can.

FINAL THOUGHTS

A picture is worth a thousand words, and if that is the case, the P&L is worth ten thousand. It speaks volumes about your business. A customised report tailored to your specific business model is an invaluable source of information for timely and informed decision-making.

P&L’s of the 20th century contained all manner of boring and generic “accounting-speak”.  Luckily for us, in the 21st century, there is a lot more freedom in how businesses are defined.

The P&L is undoubtedly an essential statement for any business owner to read and understand at a glance. Let’s make the once-off investment of setting it up beautifully at the outset to reap the benefits in the long term. The P&L has profound insights to offer on your business if it is designed well. The name of the game is management through conscious business design, and the modern marketplace demands it.

Speak to our helpful consultants , they are available for your reporting and business processing needs.

👉  READ: Part 3 – An Explanation of the balance sheet for business owners

Related Insights.

How to Fund your Business and Unlock Growth

Read More

Birkenstock’s Billions: Getting Comfortable with Business Valuations

Read More

Financial Due Diligence in a post-Covid world

Read More

South African Taxation Considerations of Virtual Currencies for Individuals

Read More

Financial Systems Case Study: The Tile House

Read More

Financial Systems Case Study – Musgrave Spirits

Read More

Understanding and achieving a healthy cash flow [Part 4/4]

Read More

Understanding Key Performance Indicators

Read More

The purpose of a management report is typically to gather data from the various parts of a business in order to report back to management on certain key performance indicators (KPIs). Business owners and stakeholders often rely on timely and relevant reports for strategic decision-making and goal setting.

In a time when businesses and stakeholders are increasingly adapting to the automation and digitisation of processes, management reporting has begun to take on a new meaning. Because of automation and digitisation, management reporting can now seamlessly form part of a business’s everyday operations rather than being a time-consuming side project. This means that time and energy is not spent on laboriously putting together a management report that could still be riddled with errors. Automation has made this process almost instantaneous and far more accurate.

HIGH-QUALITY MANAGEMENT REPORTING

Management reports are only a useful tool if they are done properly; a poorly prepared or presented management report can be frustrating and misleading. The following attributes are fundamental for high-quality management reporting:

  • Accuracy 

Accuracy is driven by the quality of the input data and processes used to generate the management reports. Efficient automation relies on robust checks and balances built into the system.

  • Timeliness 

Management reports are only as valuable as they are relevant and timely. It is imperative that the framework used for drawing up management reports should be adaptable, so that a change in the inputs or format can be adopted swiftly without compromising deadlines in the reporting process.

  • Relevance 

Typically, daily processing, operations and risk assessment functions are carried out at various levels of the business. Depending on the size of the business, directors and owners may be far removed from the day-to-day functions, focussing instead on higher level strategy and goal setting. This separation of duties makes it all the more necessary to ensure that dashboards, ratios and analyses presented in the management reports are useful for the decision maker who may be far removed from the granular detail on the ground.

THE EFFECT OF AUTOMATION ON THE MANAGEMENT REPORT

For a small business operating in a high-pressure environment with limited segregation of duties, the requirements for a good management report can seem daunting. Luckily, automation helps with all three aspects.

Business owners may view operational processes and management reporting as conflicting priorities, and they may choose to focus on the former. Again, automation eliminates this dilemma. In this way, automation can be viewed as an enabler of good practice.

Below are some examples of business process automation. The resulting efficiencies materialise in timely, relevant and accurate management reporting:

  • Automated, real time bank feeds to replace manually captured of bank statements,
  • Digital sign off of invoicing and expenditure,
  • Electronic logbooks,
  • Automated prompts to signal  required action for individual and team tasks.

MANAGEMENT REPORT FORMAT

So what does the perfect management report look like? Whilst there is no prescriptive management report format, there are guidelines for representing effective management reports that add real value.

Management reports will typically comprise the following:

  • Executive summary
  • Statement of financial position*
  • Profit and loss statement*
  • Cash flow statement*

*These will be covered in future articles in this blog series.

EXECUTIVE SUMMARY

The executive summary provides the reader with the key highlights for the reporting period. A well-presented executive summary should paint an accurate and concise picture about the following:

  • Key focus areas and the action required
  • Financial position
  • Key performance areas and metrics
  • Operations
  • Overall strategy
  • Product and/service
  • Team

The executive summary is therefore a snapshot of the entire management report and sets the tone for  key discussion areas in the management meeting.

MANAGEMENT MEETINGS

Management meetings present the opportunity for active engagement between management and the financial advisor. This in turn directs the strategy that will be applied at various levels of the business.

As with any piece of literature, certain aspects of themanagement report may be open to varying interpretations, hence the need for alignment and discussion in a management meeting.

Management reports play a crucial role in weaving together the results of daily process, performance and reporting across all pillars of business. They present the big picture and provide the clarity that business owners need in an increasingly dynamic world.

Speak to our helpful consultants , they are available for your reporting and business processing needs.

👉 READ: Part 2 – A business owner’s guide to understanding and working with the profit and loss statement

Related Insights.

Unlocking the secrets of becoming investment ready

Read More

Financial Systems Case Study: The Tile House

Read More

Systems Newsletter – VEND/YOCO Integration

Read More

Financial Due Diligence in a post-Covid world

Read More

An explanation of the balance sheet for business owners [Part 3/4]

Read More

Equity Incentives – A game changer for SMEs

Read More

COVID 19: Working from home tax deduction

Read More

Do you have a will?

Read More

This is a topic that is very close to my heart and I am sharing this everywhere I go. A couple of years into my career as a chartered accountant I started to wonder if I was still enjoying working in the finance industry. I was busy with so many routine, tedious tasks that it felt like I was not growing and it did not feel like I was making a difference in other people’s lives. I was so consumed with day-to-day accounting tasks that I did not have time to monitor the financial health of businesses I was taking care of, or to provide valuable feedback to business owners.

All of this made me question my career choice. In other industries I could see innovation and people who were fulfilled by their work, and I remember thinking that there must be a way to make accounting enjoyable and fulfilling.

CLOUD ACCOUNTING DISRUPTS THE FINANCE INDUSTRY

Cloud accounting is a term that did not exist in my vocabulary a couple of years ago, but it completely changed my life and my thinking. Learning this term saw the beginning of an incredible journey for me where I went back to enjoying finance work again.

I stumbled upon cloud accounting while reading the Entrepreneur magazine and saw an advert for Xero accounting software . The tag line was “Real-time accounting”. It caught my eye immediately; I have never seen “real-time” and “accounting” in the same sentence. At the time, I had been working in the finance industry for over ten years. What I had experienced was that we as accountants were usually playing catch-up. In general, we were processing financial and business information that had happened a few months or even a few years ago. The idea of “real-time accounting” seemed unreal to me!

I knew that cloud accounting would cause disruption in the accounting and finance industry, probably in the same way that Uber disrupted the public transport sector and Airbnb disrupted the hospitality industry.

WHY CLOUD ACCOUNTING IS SO ENJOYABLE

After reading the Xero advert in the Entrepreneur magazine, I decided to propose this new technology at the company where I was working at the time. We switched from a desktop accounting software to Xero. The switch was easier than I thought. Suddenly I had access to a variety of amazing features that I never knew existed. A whole new exciting accounting world opened up for me. I could write an entire book about how this change improved my life but to give you a glimpse of what these features mean, I will only share a few of them. Just a disclaimer: I am going to talk about automation – a lot.

▪︎ WAY BETTER ACCOUNTING WORKFLOW

Firstly, let’s talk about aesthetics. Xero has been designed specifically for the web so work screens are straightforward and user-friendly. The platform is also great to look at and easy on the eye. This may not seem to be that important, but when you spend hours staring at a screen you want to be interacting with the best-looking platform possible.

Not only is the design well thought out, but the logical flow of transactions happens much more efficiently than I have ever seen before. There is no more batch capturing, but rather a transaction flow. The cloud accounting software links directly with your bank. It feeds transactions automatically to the software, matching automatically with source transactions, for example, matching the supplier transaction with supplier payment. All you have to do is click OK.

▪︎  GOING PAPERLESS

Xero’s platform allows for every transaction to have a source document digitally attached to the transaction. There is drill-down functionality available from the general ledger, and you can click right through to the supplier invoice. It makes any query and audit way easier than before. No more looking for source documents in files and no more worries that files or paperwork might get lost. All of this is then saved securely on the cloud.

Since the application is web-based and all the information is on the cloud, it enables me to access this from anywhere I have an internet connection.


It means that I have the freedom to work from anywhere and check up using my mobile phone. How incredible is this! I am not bound to a desk anymore. 


▪︎ AUTOMATION IS THE NAME OF THE GAME

I have mentioned the automatic bank feeds already, but this is only the beginning of automation in Xero. There is an automatic link to XE.com , so multi-currency transactions are converted automatically to your reporting currency. When you pay the foreign supplier or receive money from a foreign client, Xero calculates the foreign exchange profit and loss and posts the journals automatically.

Fixed assets are a breeze. The fixed asset register is integrated into the software and at month-end or year-end, you only have to click one button and depreciation gets calculated automatically, and journals are posted (yes, you guessed it) automatically! The level of automation is unheard of in other accounting applications.


In summary, the automation functions in Xero save me a significant amount of time. This is time that I can spend on things that matter and that actually bring about positive change.


OLD DESKTOP SOFTWARE FRUSTRATIONS

When I think back to the days when I was using old desktop accounting software, I remember how miserable and frustrated I felt. Compared to what I know now the software design was terrible. It took me hours to capture transactions manually, and there was so much room for human error. Things like typing errors, miscalculation mistakes, and misallocation errors could easily slip through the net.

In addition to the potential for errors, you could only work from a computer where that file was located. You had to have a very reliable backup procedure in place and make sure the file did not corrupt. Every year you had to ensure that you received the updates from the software company and then install the latest version on your computer. Just talking about all these frustrations makes me feel exhausted. No wonder I was so miserable and unhappy in the finance industry.

With all the software housekeeping, back-and-forth using non-automated software and ensuring that I had not made a mistake I never felt like I was adding real value to businesses. I never had time for the exciting things, like forecasting and presenting valuable business insights to business owners and helping them to grow their business.

NOW I HAVE TIME TO DO WHAT ACTUALLY MATTERS

Since the routine tasks are taken care of with cloud accounting and I know that the financial integrity is of a high standard, I can now focus on monitoring the financial health of businesses I look after and providing regular and valuable feedback to business owners.


I am now able to improve financial reporting and be innovative with bringing the business numbers to life so business owners can make better decisions.


I am not stuck in the past anymore, and I am certainly not playing catch up all the time. Instead, I can look ahead in business and focus on cash flow forecasts and company targets and help business owners prepare for what is coming.

I AM A HAPPY ACCOUNTANT AGAIN

Cloud accounting made me enjoy the finance industry again. It enables me to contribute in a meaningful way to businesses by utilising my financial expertise on a level that matters.

The routine tasks are necessary, but with this great new technology available you do not have to waste time by doing it yourself anymore. I am also a happy accountant because I help other accountants and businesses switch toXeroand make them aware of this brilliant technology. I love to see how people’s lives are improved and how stress levels decrease because the automation of cloud accounting brings freedom and joy.

Now that you are totally convinced to switch over, click here to get started.

Related Insights.

The Melting Ice Cube Series – Part 1 – Holding Cash: A Melting Ice Cube

Read More

Financial Systems Case Study: The Tile House

Read More

Manufacturing in Xero Part 2

Read More

An introduction and high-level overview of the value of management reports [Part 1/4]

Read More

Financial Systems Case Study – Musgrave Spirits

Read More

COVID 19: Working from home tax deduction

Read More

How to Fund your Business and Unlock Growth

Read More

A business owner’s guide to understanding and working with the profit and loss statement [Part 2/4]

Read More

While the pandemic has forced many employees to work from home, you may be wondering if you now qualify for the home office tax deduction. We outline the requirements for employees to qualify below.

Requirements to deduct home office expenses

  • You are currently employed and working for a salary / commission
  • You are required by your employer to work from home
  • You have an office / area that is used regularly and exclusively (more than 50%) for your work i.e. the kitchen counter would not suffice
  • Your office is specifically equipped for purposes of the trade e.g. fitted with a desk, computer and printer

What expenses can you deduct?

  • Rent
  • Interest on bond
  • Rates and taxes
  • Cleaning
  • Wear and tear
  • Repairs to the office
  • Other expenses relating to the office

Ifmore than 50% of your remuneration is comprised of commission you can also deductcommission related business expenses i.e. telephone, stationery, repairs to printer etc.

How to calculate home office expenses

If the expenses relate to the residence as a whole, the expense must be apportioned as follows:

A/B x total costs, where

  • A = The square metre area used for work
  • B = The total square metre area (including any outbuildings and the area used for work) of the residence
  • Total costs = the total costs incurred for the acquisition and upkeep of the property (excluding expenditure of a capital nature)

If the expense is a specific business expense then the entire cost is deductible.

2021 tax year 

If you have been working at home due to COVID-19 you will only be able to claim this deduction for the 2021 tax year if you will have worked from home for at least 6 months of the tax year and meet the requirements above.

Related Insights.

Manufacturing in Xero Part 2

Read More

Create a cash flow friendly business

Read More

Manufacturing in Xero Part 3

Read More

NEW DESIGN – 2020 Tax Filing Season for Individuals

Read More

Unlocking the secrets of becoming investment ready

Read More

Are you Investment Ready?

Read More

Financial Modelling for Business Lift Off

Read More

A business owner’s guide to understanding and working with the profit and loss statement [Part 2/4]

Read More

Let’s say your business finds itself in a position where an investor has shown an interest in injecting cash into your company. Whether this investment comes in the form of equity or as a loan to be repaid, the investor will usually want to see specific information about your business.

At this point, the investor will start using technical terms and sometimes they might seem to be speaking a different language. Essentially, the investor wants to assess your business’s financial risk profile . This is a combination of business and financial data about your company that helps the investor decide whether or not to invest. In this article, which is part 1 of this series, we are going to help you understand the process of determining your company’s risk profile.

The seven key indicators of financial risk

There are seven key indicators of financial risk that provide insight into management’s ability to lead the business through economic, market, and competitive challenges. They are not the only relevant indicators of risk, but they are what the analyst uses to launch an assessment.

These seven core cash drivers are:

  1. Sales growth,
  2. Gross margin,
  3. Operating expenditure percentage,
  4. Accounts receivable days,
  5. Inventory days,
  6. Accounts payable days, and
  7. Net capital spending.

A complete financial risk assessment consists of a thorough analysis of financial statement data and notes, financial ratios, cash flow and projections. This is key in determining the overall credit risk profile of a business and is more than just whether you can borrow or how much you can borrow. It is a temperature check of the overall health of your business, although the numbers are just one tool in the analytical process.

🔸 What can sales growth tell you?

Sales growth is a measurement of the rate of change in sales from one comparable accounting period to the next. Understandably, it is one of the most important drivers of profit in risk and cash flow assessments. It impacts many income statement and balance sheet accounts. Well-managed sales that are less volatile allow management to chase growth using the cash generated by the company rather than using borrowed (and therefore more expensive) money. This lower debt decreases your financial risk and supports more sustainable growth.

Rapid sales growth, for instance, tells the analyst that a higher level of operating assets and cash will be needed to support this growth, and the question is then whether the company is fully prepared to scale up its operations and sustain this growth trajectory. A large increase in sales is likely to increase trade debtors and inventory, which puts a strain on cash, perhaps even creating the need to initiate or increase debt. The interest now due will offset the increase in revenue. Management should have a clear strategy and detailed cash flow forecasts to proactively monitor and control this growth phase.

The reason for the sales growth is also a key factor to be considered, whether it be, for example, reduced prices to improve sales, a competitor leaving the industry, or a new product or technology that boosts sales. Alternatively, increased competition, the resignation of a key sales representative or a recession could adversely affect sales. The impact on cash and profitability needs to be accurately recorded, and the duration of the deviance is also a factor that impacts the overall financial risk profile.

🔸  Why the emphasis on gross margin?

With the exception of the services industry, production costs are typically the largest costs of doing business, and the gross margin is therefore a major influence on the profitability of a business, and the first indicator of a business’s ability to be profitable. Gross margins vary greatly for different industries and business types. The analytical value derived from this driver includes a comparison to industry benchmarks. The margin is affected by management decisions, industry influences, and global economic conditions. In general, the higher the margin, the lower the financial risk and the stronger the cash flows of the company.

There are a number of potential scenarios that may influence the gross margin of a company. For instance, a material supply shortage in an industry could drive up production costs and lead to lower profits, or the global economy could be beset by inflation or a recession, although the former could be offset by a price increase. Automation of the production process would impact the costs that affect the gross margin. Similarly, a decision by management to cut selling prices could also influence the margin. Overtime incurred to meet an increased demand would have a positive effect on the margin if the increased production is scaled to exceed the increased production costs. These are all examples of scenarios that influence the gross margin which could be used by analysts to determine the financial health of a company and its prospects with respect to profitability and cash flow.

🔸  How important are operating expenses (“opex”) as a percentage of net sales?

Opex as a percentage of net sales gives us a ratio that represents the portion of gross margin consumed by expenses related to selling, general and administrative costs. The ratio is a keen measure of management’s ability to manage expenses consistently throughout various phases of the business cycle. Absolute levels and trends in this ratio are highly informative about the operating efficiency of a business, with an inverse relationship. The lower the costs, the higher the suggested operating efficiency. As with most indicators, the level of opex varies greatly from one industry and business type to another. The most useful comparison is that of a company’s opex to the industry benchmarks. The lower and better controlled a company’s opex is, the better its financial risk profile.

In the scenario of a recession, which would imply a drop in sales, some variable operating costs would decline because they are directly linked to the sales volumes, but fixed costs would be fairly rigid. If the company has a lean opex structure, it will be more resilient to the recessionary effect, and the opex percentage would remain fairly stable. Management would thus be maintaining a stable financial risk profile.

The historic trend of the opex ratio would also be an indication of the stability of the business and of its ability to withstand external pressures, such as competitive forces (higher rental at better premises) or industry changes (such as wages). A consistent ratio that is fairly low if benchmarked to industry norms will be reflective of consistent management policies and strong controls governing expenses.

🔸  What do accounts receivable days, inventory days, and accounts payable days indicate?

Accounts receivable days, inventory days and accounts payable days are activity ratios that help the analyst to gauge the financial risk profile of a company. This is because all three components impact heavily on the cash flow position. As for all other indicators, these measures vary from industry to industry and benchmarks are the most useful comparison to determine the health of the ratios. Factors such as seasonality and the location of the debtor, creditor or business (terms) and source of inventory will play a role in determining the risk profile too. A comparison of historical measures and trends will indicate the stability of the cycle for debtors, creditors and inventory.

Accounts receivable days refers to the average time it takes to collect cash from customers for the sale of products or services. This is an indicator of the efficiency of the collections process and management of the debtors. A more efficient process will result in fewer accounts receivable days. The better the receivables are collected, the better the cash flows and the stronger the financial risk profile of the business. It is important to know what influences the time taken to collect the debt, as this understanding will support the perception of the reliability of cash flows. If a customer has longer terms either to boost their support or to accommodate specific trading circumstances, cash flow may need to be substituted to compensate for this, thus weakening the financial risk profile.

Accounts payable days refers to the average time it takes a business to repay its suppliers, and it is similar to accounts receivable days but in a converse relationship. Taking longer to pay a supplier may slow the outflow of cash but it can penalise the business if a discount is available or the company’s credit rating and/or reputation is adversely affected. The effect of discounts available for payments made should be compared to the equivalent cost of borrowed funding that may be required to pay creditors early. The financial risk profile is determined on the back of a thorough understanding of the components of the ratio.

Inventory days refers to the average time it takes a business to sell its stock. The more efficiently inventory is controlled, the lower the inventory days will be and the stronger the financial risk profile of the company. Peer comparisons are a good benchmark of the effectiveness of the inventory policies and procedures. The faster inventory is turned into sales, the better the cash flow into the company. Trends in this ratio are important as they could indicate slow-moving or obsolete stock, fast-moving stock that is in high demand, and various other scenarios that would require proactive management. Detailed inventory information will assist management in making sure that inventory is relevant and sought after, and that excess cash is not absorbed by the inventory cycle.

🔸  What is the relevance of capital expenditure (“capex”) or net capital spending?

Capital expenditure (“capex”) is often grouped with gearing, liquidity and debt service coverage measures to provide insight into financial risk evaluated by an investor or lender.

Although capex falls outside of the trading framework of a company, it has a direct impact on the cash resources of a company and the impact on the operational ability of the company should also be considered. Net capital spending is the difference between the amount of cash spent on fixed assets and the amount of cash received from the sale of any assets in any one year. An investment in a capital asset is usually funded partly by internal cash resources and partly by external funding, particularly in relation to expansionary capex. This investment in an asset is expected to lead to an increase in the generation of revenue and future cash flows. The lag between the actual expenditure and the ability of the asset to generate revenue should be taken into account when determining the cost of borrowing money and the ability to repay that money.

A lack of spending on capital items is also a focus area for an analyst in a business where revenue is derived from the sweating of fixed assets. For example, a manufacturing firm that has assets that constantly need repairs and that have been written down to a nil net book value in an industry that is exposed to technological advancements will indicate a high risk. In conjunction with this perception, future expected capex must be planned for as it is critical both in terms of cash flow projections and operational efficiencies.

🔸  Are these the only relevant contributors to a financial risk assessment of my business?

These seven factors form the initial phase of a financial risk assessment. They are not the only relevant contributors but they are what the analyst uses as a springboard to launch an assessment. Once you understand these seven basic factors the elements that follow on from this will make sense. After the initial assessment, your business’s risk profile will then be layered with a further analysis of more complex financial elements to determine a holistic picture of the financial, business and blended risk profile of your company.

Reference: Moody’s Analytics

Related Insights.

Birkenstock’s Billions: Getting Comfortable with Business Valuations

Read More

Equity Incentives – A game changer for SMEs

Read More

South African Taxation Considerations of Virtual Currencies for Individuals

Read More

Financing your Company’s Growth – Ask us how to take your business to the next level

Read More

The Melting Ice Cube Series – Part 1 – Holding Cash: A Melting Ice Cube

Read More

Systems Newsletter – Fixed Assets In Xero, DEAR Features And New Systems

Read More

How cloud accounting made me enjoy the finance industry again

Read More

An introduction and high-level overview of the value of management reports [Part 1/4]

Read More

In response to COVID-19, SARS has re-designed the 2020 tax filing requirements for individuals.  Some material changes have been made to simplify the process and remove the need to visit SARS branches in an aim to become more efficient and observe social distancing.

Through the increased use of third-party data, SARS will be completing your tax return for you. Where SARS has the required information they will provide you with a proposed auto-assessment without the need for you to file a tax return. This enables you to view, accept, or edit your proposed assessment online using eFiling or SARS MobiApp.

The 2020 tax season (period 1 March 2019 to 29 February 2020) for individuals will open 1 June 2020 and it will be staggered as follows:

Auto-Assessments
1 June 2020 – 31 August 2020 SARS will issue auto-assessments based on third party data (e.g. employers, medical aid, pension funds, etc) and provided claims are not anticipated (e.g. travel allowance). Taxpayers have the opportunity to accept auto-assessments or not as per below:

  • During August auto-assessments will be issued and taxpayers will be notified by SMS
  • Taxpayers have the opportunity to confirm acceptance of the auto-assessment afterverifying the accuracy OR if you do not agree with the results or anticipate claims you can edit the information and resubmit your income tax return from 1 Sept
  • If you accept the auto-assessment under or overpayments will be processed as normal
  • Taxpayers who are NOT required to file will be informed – details to be advised
  • Taxpayers who are required to file from 1 Sept will also be informed – details to be advised
Filing 
1 Sept 2020 – 16 November 2020 Non-provisional taxpayer eFiling
1 Sept 2020 – 22 October 2020 Non-provisional taxpayer Branch filing by appointment
1 Sept 2020 – 29 January 2021 Provisional taxpayer eFiling

It is important to note that SARS will be relying on data collection from both local and international third parties.

Creative CFO welcomes this trend towards automation if it saves you time and money, and we see this as the first step towards future digital submissions. We are here to assist you in navigating these changes and make the most of the new technology.

If you have any questions please contact our Tax Team here.

Related Insights.

Are you Investment Ready?

Read More

Do you have a will?

Read More

Manufacturing in Xero Part 2

Read More

Financial Due Diligence in a post-Covid world

Read More

Unlocking the secrets of becoming investment ready

Read More

How to Fund your Business and Unlock Growth

Read More

Manufacturing in Xero Part 3

Read More

Equity Incentives – A game changer for SMEs

Read More

So you’ve been thinking about growing your business and you’re full of ideas. But then you start to think about financing that growth and the glow of enthusiasm dulls as the questions form in your mind. How much financing do you need? How do you get it? From where?

Financing always seems to come with mountains of paperwork, which doesn’t appeal to many business owners. But there is an easier way, which involves getting Creative CFO to help. We have the team, skills and affordable products to help your business grow, with a straightforward approach that will not overburden you or your company.

A business poised for growth or a strategic shift is faced with the following questions:

  • What to finance?
  • Where to look for funding?
  • What is the company’s optimal debt capacity?

Creative CFO can help you answer these questions.

Adding debt to the balance sheet

Even if a company has cash resources, these are usually needed for the day-to-day running of the business and working capital needs. If cash resources are used to fund a project or to pay for an asset this will place a huge strain on operating cash requirements.

An alternative to depleting your available cash resources is applying for a loan which will introduce new debt to your balance sheet. Adding debt to the balance sheet may be scary, but if it is responsibly taken on, it will not overburden the company. Rather, it will support growth and create a new generation of cash flow. For a completely new project or a new source of revenue, debt funding combined with an equity injection could be the best way to source cash.

What is the invested cash used for?

Not all the cash invested or lent to the business is necessarily used to pay for new assets. It could be to support the initial increase in operating costs, such as new staff members, or to pay rental for increased office space. These are just a few of the daunting decisions that a business owner needs to make. That’s why Creative CFO offers a range of expertise and investment products developed to take a business to the next level. We have the experience and knowledge necessary to shoulder some of the burden as we offer solutions that are tailored to your company’s needs.

Applying for funding

A survey conducted in 2018/19 revealed that access to finance is the biggest barrier to success for an SME. This is because SME’s face several challenges when they apply for new funding. Banks and financial institutions remain cautious of lending to SMEs, largely due to the perception that the risk of recovering the loan will be too high. Historically, the lender has much more negotiating power than the SME. Creative CFO believes in helping SMEs succeed, which is why we strive to make the credit market more accessible and return some of that power to the SME.

We want to partner with our clients to build sustainable businesses with a stable balance sheet, and to maximise the SME’s ability to exploit growth opportunities without exorbitant costs or an onerous borrowing structure. We know that each SME is different and has the potential to tap into unique possibilities. Together we will explore the options available to develop a bespoke balance sheet structure that will maximise your potential and help to build a successful and sustainable business.

Creative CFO’s approach

Creative CFO has a flexible approach to assessing a business and its associated risk profile. Our assessment is not based on the conservative principles applied by first-tier lenders which are better suited to large corporations. We will assess your risk profile on a stand-alone basis, with no preconceptions, coupled with an understanding of the business’s financial and operational structure and performance, the industry that it operates in and the competitive advantages that make it unique.

The Independent Business Review

An example of a product offering that could support effective strategic growth is the Independent Business Review. A business review is an objective assessment of the commercial and financial position of a company to determine its future viability. The review is made available for both internal and external stakeholders. The review includes a stress test of management’s business strategy and plans for real challenges and opportunities. It also evaluates the risk of meeting performance forecasts, and identifies potential upsides that could be exploited.

In performing this review, we focus on market prospects; customer and product profitability; working capital; funding structures; and management processes. After an initial assessment, we would meet with you or the necessary representative team to discuss what you would like to achieve and what your concerns are. Then we do a deep-dive into the business and prepare a succinct report.

How does the business review help?

The report can assist management in addressing the areas of the business that are identified to refine current processes and policies, and introduce cost savings, optimise operating efficiencies and generally streamline and refine the business model to strengthen net cash inflows and the operating performance.

A business review can expose those areas of the business that will benefit from a cash investment, and explicitly indicate how the cash can be applied to introduce new or increased cash flows. One example of this would be to highlight the need for a vacant role to be filled so that vital financial functions are performed that can strengthen the working capital cycle and increase the cash inflows.

An independent business review will also indicate pressure points such as direct costs that impact margins, whether optimal pricing decisions are in place (including whether customers are price sensitive), and what economies of scale would be introduced by certain volumes of product. A trajectory that shows a negative correlation between increased production versus fixed costs will appeal to a funder, and provide reassurance that new cash inflows can support debt repayments. In short, the review will communicate vital data about your business to the lenders.

Applying for funding is a big step for an SME. It can be tricky to convince lenders that your business is the right one to invest in, but this is where a business review and the advice of Creative CFO will stand you in good stead. When you are ready to take the plunge and accelerate the growth of your company, contact your Creative CFO financial manager, or email our Investment Team to find out more.

Related Insights.

European vs South African Valuations – A Triple Edged Sword

Read More

Systems Newsletter – Systems VAT Update

Read More

Financial Systems Case Study: The Tile House

Read More

Systems Newsletter – VEND/YOCO Integration

Read More

The Melting Ice Cube Series – Part 1 – Holding Cash: A Melting Ice Cube

Read More

Are you Investment Ready?

Read More

Understanding Key Performance Indicators

Read More

Financial Systems Case Study – Musgrave Spirits

Read More